I was laying in bed yesterday, somewhat jet lagged, waiting to go to dinner, idly watching CNN, with this guy, Smerconish, talking about the newly passed GOP tax reform.
At some point a guest was introduced. And he was introduced as a somewhat legendary figure. An economist who had worked during Reagan administration as a member of his Economic Policy Advisory Board.
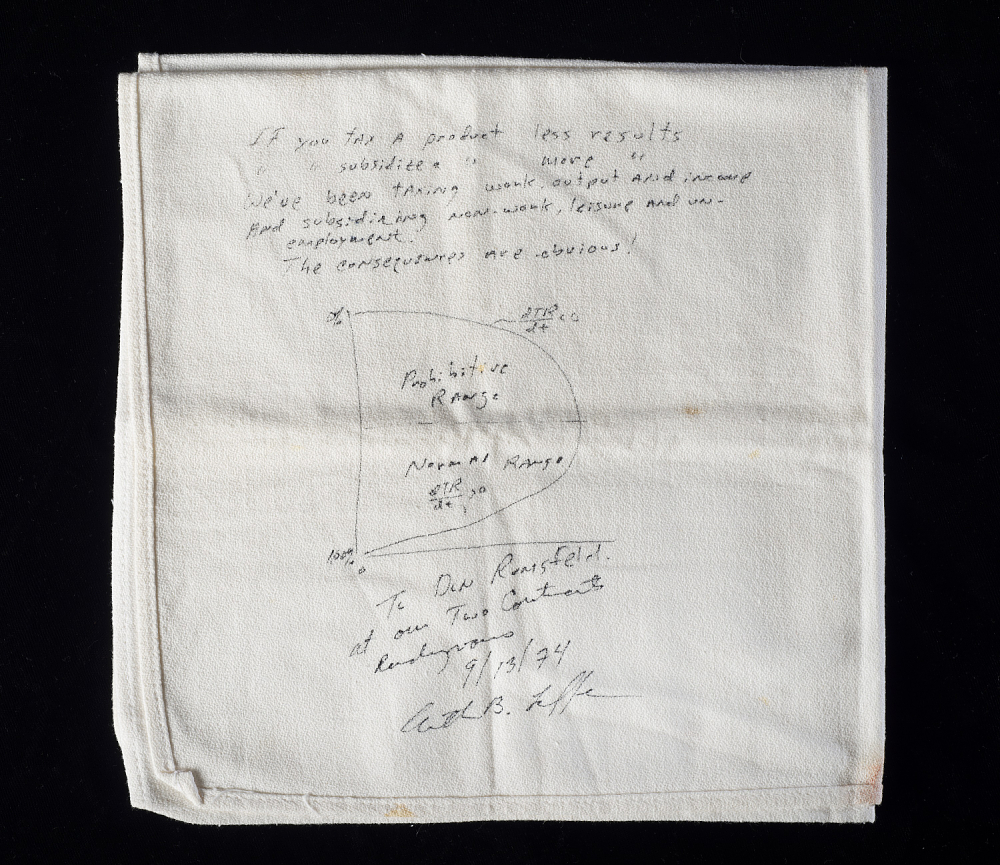
But the legend of this man comes from a dinner in 1974 held at the Washington Hotel in Washington DC. During this dinner mythology wants that our hero sketched a now fundamental pillar of economic science on one of the napkins trying to convince flabbergasted Dick Cheney and Donald Rumsfeld that raising taxes is not always a good idea and higher taxation doesn’t necessarily mean higher revenues for the government.
The rest is history and the Napkins is today part of collection at the national Museum of American History, sic.
Our man is Arthur Laffer and the content of his napkin graffiti is the omonimous Laffer curve.
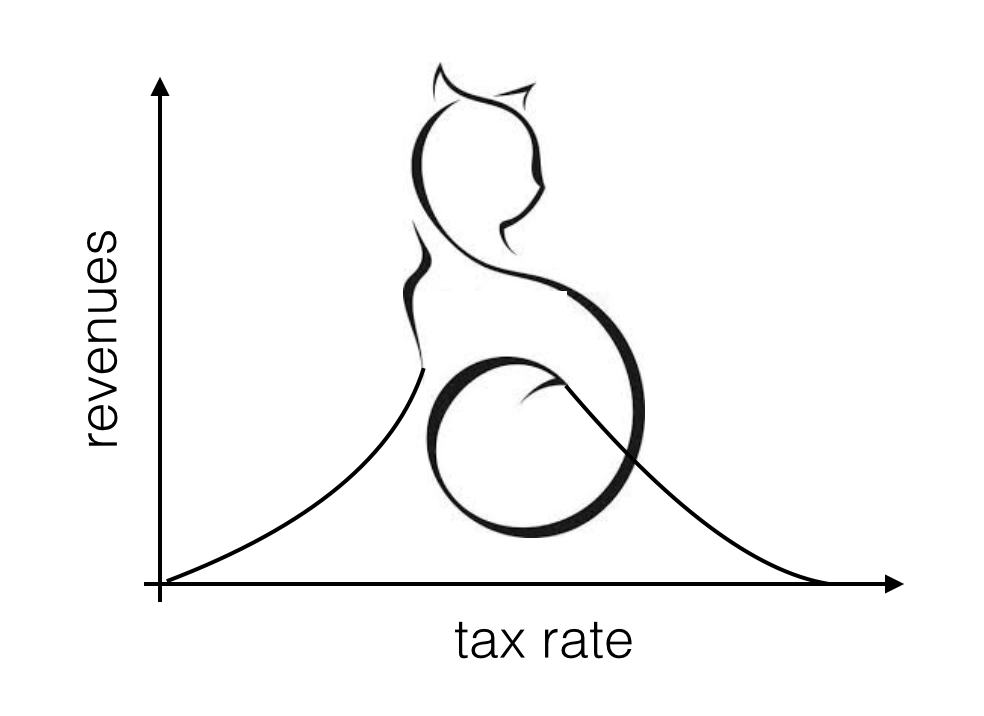
So what’s the Laffer curve? It looks like it must be something fundamental as it is often cited (at least by media and politicians) as the reason why lowering taxes is awesome. The ‘idea’ is simple. Suppose you have a country and everybody pays a given fixed fraction of their income in taxes. This fraction can go from 0% to 100%. How does the government tax revenue varies with this fraction?
Well if the taxation is 0%, clearly there are no revenues for the government. Increasing taxation above zero will then increase the revenues above zero. So why not cranking taxation all the way up to 100%? Well, at some point if you tax me too much I will just say “WHATEVER” and I’ll stop buying stuff, industries will stop producing stuff and we will all just lay in bed doing nothing because it is not worth it. So the assumption is that revenues for the state will not increase forever with the tax fraction but at some point will start to go down finally becoming zero again if taxation is 100%.
This sounds plausible: the State revenues are zero if taxation is either 0% or 100%. But if you are at dinner and you have a pen and a napkin you may be tempted to join those two extrema with a curve, a simple enough curve, because Dick Cheney is looking at you and you don’t want to mess with Dick Cheney (no you don’t). And if you do so you realize that, everytime, the curve you have drawn has a special point. Since State revenues are positive, somewhere between 0% and 100% taxation there is a value for the tax rate, call it T, for which the State revenues are maximized! WOW!
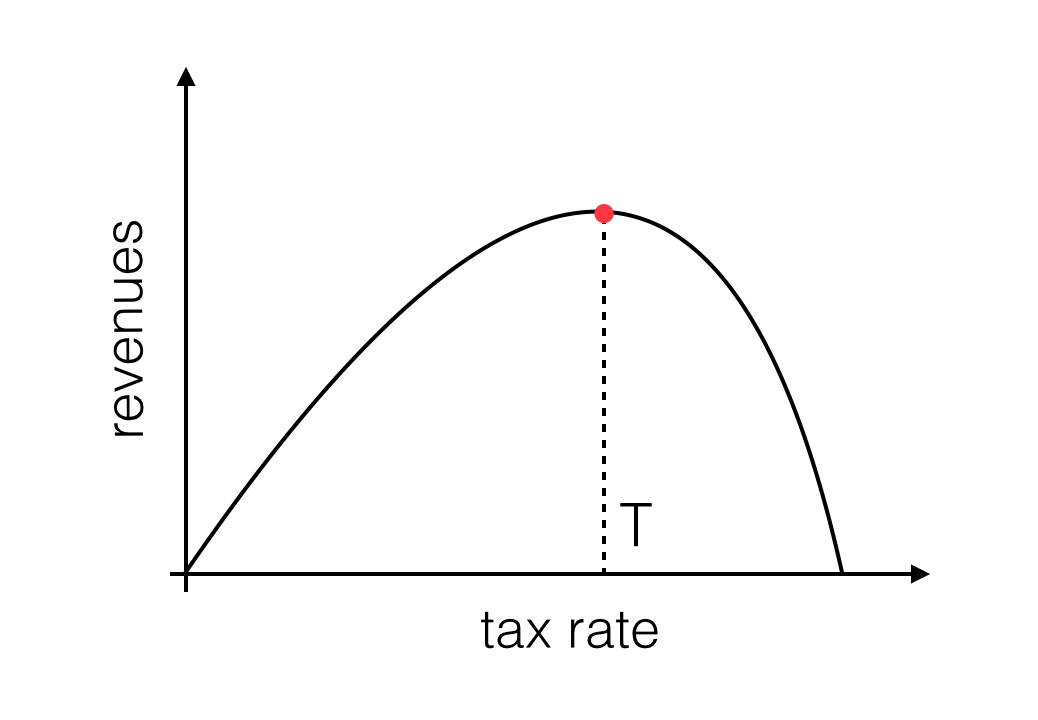
So, picture yourself as Dick Cheney now. Keep in mind that 28 years from now you will say, with a straight face, that “Simply stated, there is no doubt that Saddam Hussein now has weapons of mass destruction”. I guess it won’t take much to convince yourself that our current taxation HAS TO BE on the right of the special point T. So lowering the tax rate you will increase the State revenues. Notice that this sort of reasoning doesn’t really depend on the actual value of T. And it actually doesn’t even depend on whether T actually exists. B-)
Jokes aside, it is clearly obvious that no conclusion can be obtained from the observation that State revenues will be small for a tax rate of 0 or 100% (it is actually not even obvious to me that revenues will be zero for 100% taxation, but whatever). But let’s go through the various loopholes anyway.
My readers (according to Google Analytics they are a folk from Russia and another one from Boston) will surely recognize in the previous explanation of the Laffer curve, a statement of the so called Rolle’s theorem:
“any real-valued differentiable function that attains equal values at two distinct points must have at least one stationary point somewhere between them”.
In particular if the function is positive there will be a maximum. This is the special point T.
The first obvious argument against the proposers of lowering taxes because of the Laffer curve is that we may already be living to the left of T, so that decreasing taxation will also decrease revenues. Meh. Maybe T exists but it is very large, like 70%! Take this Arthur.
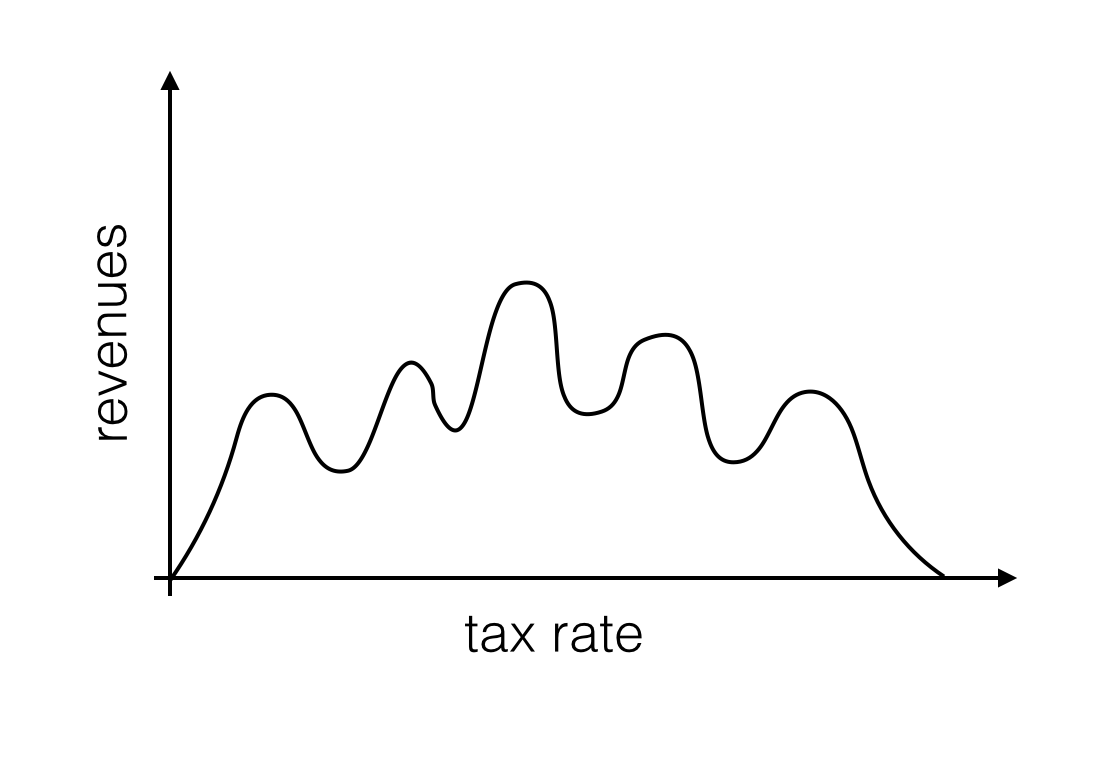
Another possible issue is that no one guarantees there to be a single maximum. The curve can have two maxima and a minima between them. Or it can be all wiggly. So if you lower tax rate by big steps you can end up in a minimum and not a maximum.
One more plausible loophole to the Laffer Napkin Theorem is the fact that there probably is no Laffer curve. You simply cannot draw it. Period. There is no differentiable function interpolating from 0% to 100% taxation. So no theorem to be applied.
This can happen for various reasons. The Laffer curve assumes there is a one-to-one relation between taxation and revenues. This is most probably false, as there may be many more variabes (I am not an economist but this sounds pretty much plausible) contributing to the Government revenues. If this is the case, for any given value of the tax rate there may be many different values for the revenues depending on the values of the other variables.
Also it can be that the actual curve giving revenues as a function of taxation is not single valued. It may be that for a given value of the tax rate T the value of the revenues depends on whether I reached T raising taxes from a lower tax rates or I reached T lowering taxes from a higher tax rate.
So to conclude, is more arguing needed in support of the statement that every conclusions drawn from the existence of a Laffer curve, and the Laffer curve itself, are pure bogus? I guess not.
AND PLEASE PLEASE PLEASE, STOP TALKING ABOUT IT, PLEAAAAAASEEEEEEEEE.
